This is the fourth installment of my essay, Tipping the Biosphere. Part II. Part III.
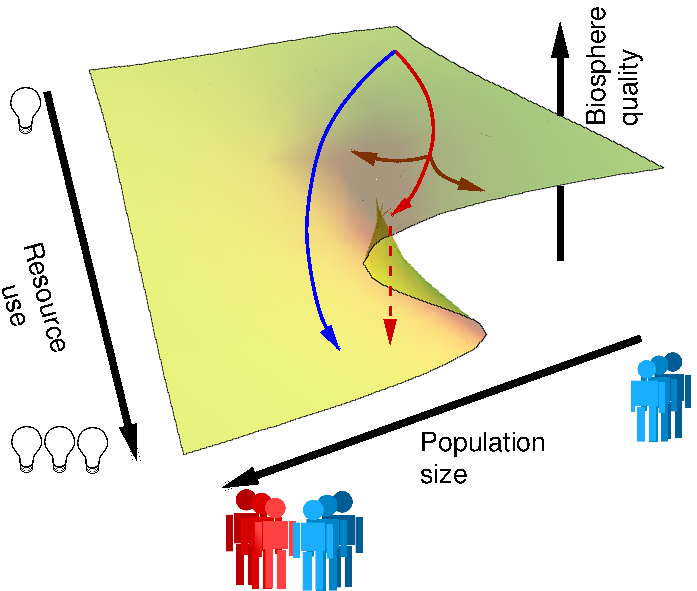
Catastrophe landscape describing biosphere state. Human history begins in the upper right region, but is now on either the red or blue trajectories. Alternative trajectories (brown), lead either to the lower right (small population, high resource consumption), or the upper left (high population, low resource consumption).
Much of our understanding of tipping points is captured by Catastrophe Theory, a deep and ominously named mathematical theory. Though complicated, the theory provides us with a useful heuristic device, the catastrophe manifold, for visualizing the manner in which a system will respond to external forces or controls[1]. The surface in the figure, known as a cusp catastrophe, illustrates the behaviour of a system that is capable of a catastrophic state shift when controlled by two parameters. For our case, the system is the biosphere and the controlling factors are population size and resource consumption. The height of the surface indicates the quality of the biosphere, with greater height corresponding to a healthier biosphere. Height, and hence biosphere quality, decrease as either population size or resource consumption increase. One can imagine the biosphere moving on this surface in response to changes in the controlling factors.
Only a small part of the surface has been explored during human civilization's brief history, and the initial position of the biosphere would have been the upper right corner; small population size and low resource consumption. We have been moving steadily since then toward the lower left corner, of high population size, high resource consumption, and a qualitatively declined biosphere. That trajectory is undesirable because of the unsustainable strain on natural resources, and all the negative effects associated with human over-population and over-crowding. This argument is indisputable, though the potential for decline must be tempered by many uncertainties, including the possibility of innovative technological and socio-political adaptations.
Furthermore, the catastrophe model is not necessarily the ''right'' model in any precise sense, but its unique contribution that demands attention is illustrated by the folded and creased region of the surface. If future population growth and resource consumption move the biosphere's state into this region (shown by the red-arrowed trajectory), the transition to an undesirable state will be relatively sudden; the biosphere will have arrived at a tipping point. This is illustrated by the abrupt change in direction of the trajectory. ''Relatively sudden'' means that the period of transition between states will be brief relative to the time spent in the current state, i.e. 12,500 years since the last ice age ended. But what does that mean, precisely? Decades? A century? Our understanding of climate and ecological systems suggests a timescale of decades, but the fact is that we simply do not know. There are no numbers on either controlling axis in the figure! In fact, the trajectory could be the blue one, in which case the state transition would be incremental, affording society more time to mitigate and adapt, though whether either would happen is also uncertain. If a tipping point does exist in the global biosphere system, the real question is, what can we do to avoid, or at least forestall, the tip?
[1] Roopnarine, P. D. 2008. Ecological Informatics: Catastrophe Theory. Encyclopedia of Ecology, Elsevier Press. p. 531-536.