Special delivery! See our visiting baby camels (Dec. 6–19) and yaks (Dec. 20–Jan. 5) this holiday. Learn more
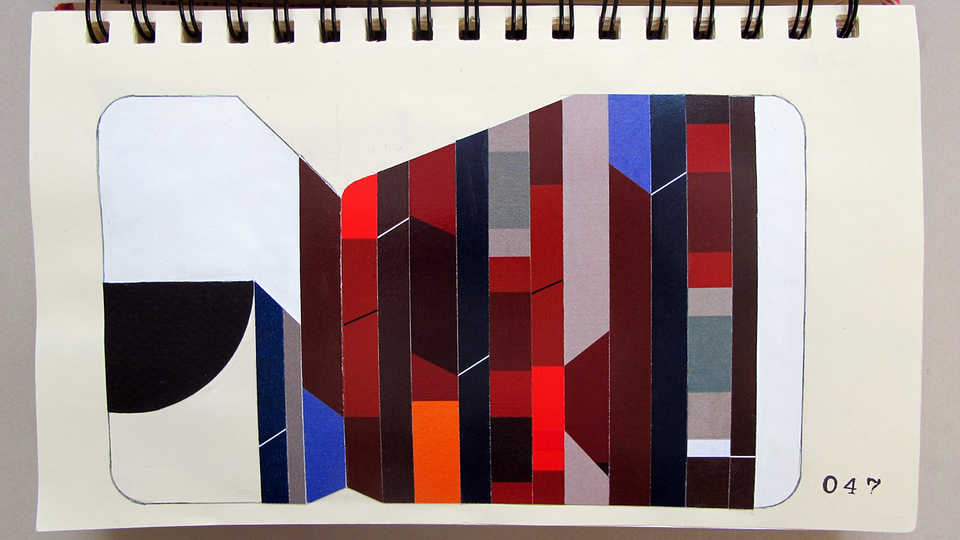
LV Sketchbook Page 047 addresses the role of color in representing and conveying information in both data and art. Color choices and placement are key to scientific charts such as one published in 2013, illustrating temperature changes on Earth’s continents over the last 2,000 years. The chart’s color scale illustrates a global temperature slide until the modern era’s warming, revealing the 20th century as nearly the warmest on all of the continents together, except Antarctica. (Interestingly, Antarctica appears to have been warmer during A.D. 1671–1700 than 1971–2000, and the entire period of 141–1250 was warmer than 1971–2000.)
In art too, color functions as a quantifier. Paul Klee wrote in 1945: "And what tremendous possibilities for the variation of meaning are offered by the combination of colors… What variations from the smallest shading to the glowing symphony of color. What perspectives in the dimension of meaning!” Yet he understood that color’s efficacy is contingent on its arrangement. He also wrote: “To paint well is simply this: to put the right color in the right place.”