We're open daily! View holiday hours
Science News
Visualization in Astronomy—and Beyond
January 6, 2014
by Ryan Wyatt
Astronomy is a visual science. As soon as Galileo put brush to paper to capture his view of the Moon through a telescope, astronomy conveyed many ideas through illustration and, eventually, photography. In just the last few decades, images from the Hubble Space Telescope have made the observatory famous—and even inspired academic musings about the cultural relevance of Hubble imagery.
So you might imagine that astronomers would leap on the latest visual tools to represent their discoveries. But that’s often not the case, as Alyssa Goodman from Harvard University pointed out in her plenary session, “Linking Visualization and Understanding in Astronomy,” at today’s 223rd American Astronomical Society meeting in National Harbor, Maryland. She pointed out that the astronomical journals in which cutting-edge results appear have changed little in the last century, and in many ways, astronomers have never even taken advantage of the innovations of “The Golden Age of Statistical Graphics” that took place during the second half of the 19th Century.
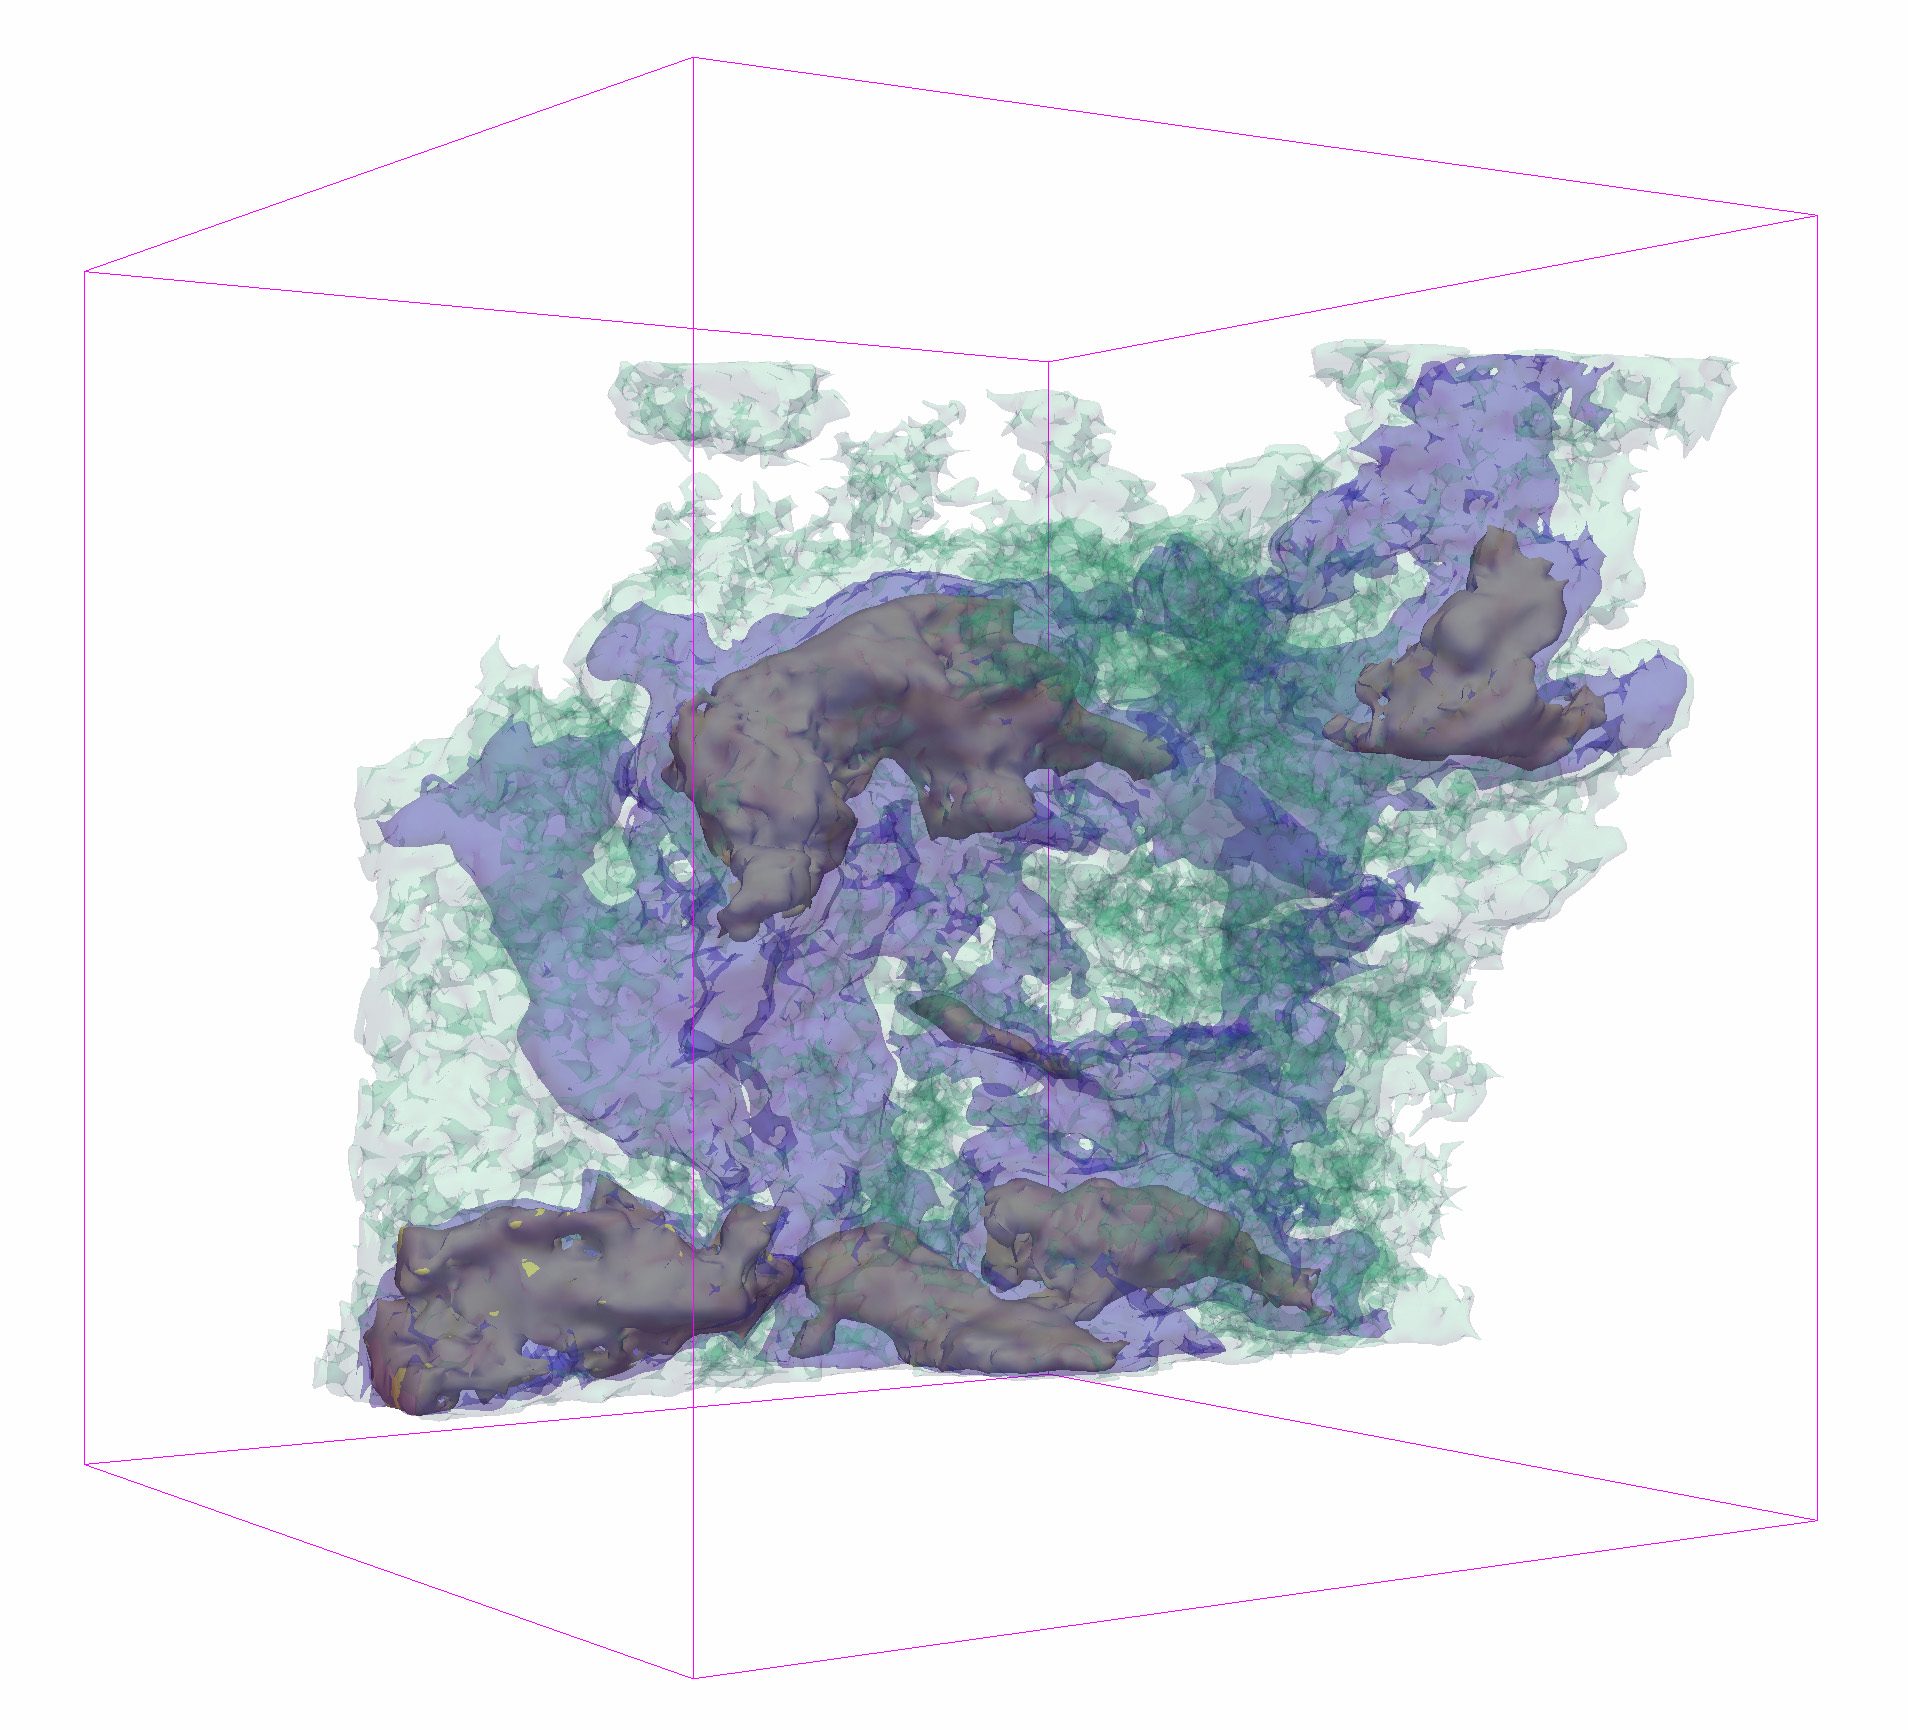
Among other things, Goodman studies star-forming regions—the quite complicated three-dimensional clouds of gas in which stars form—and traditional astronomical techniques had never quite managed to disentangle the complex structures from extensive observations. But about a decade ago, Goodman began adapting medical imaging software to study astronomical objects, allowing for a cross-fertilization of ideas and techniques. Although astronomy initially profited from the techniques used to interpret MRIs for signs of disease, the potential benefits go both ways. As Goodman noted, “The algorithms that we develop to identify star-forming clumps in a dusty gas cloud might be used to identify possible tumors in a person’s body.”
This led to Goodman delving into visualization tools and techniques, becoming a spokesperson for visualization in the astronomical community. In today’s talk, she implored astronomers to use visuals more effectively, and she introduced many tools to aid in creating more effective and more informative graphics. Some of these (e.g., Glue, D3PO, Authorea) will only interest professional astronomers—or very serious amateurs—and in addition to providing a synopsis and links, she summarizes many of their benefits in a recent article.
But even if you’re not getting your Ph.D. in astronomy, Goodman had some interesting observations and results…
First off, she talked about her experiences working with the free WorldWide Telescope software as a teaching tool, and online, you can find introductory tours as well as communities creating and sharing content.
Goodman also talked about the “readability” of visualizations that can help doctors diagnose coronary artery disease. Researchers published an article demonstrating that appropriate visualization tools could improve doctors’ ability to identify problems—both more accurately and more quickly! And one of the major issues? Good color choice. Something that many visualization wonks (including me) have been saying for years.
Goodman also bragged about some spiffy interactive software modules created by Harvard students in the past year. They cover topics as esoteric as supernovae, shockwaves, and the interstellar medium, but many of them allow users to experiment with parameters and gain a new understanding of some tricky astrophysical topics. Take a look at their site.
And finally, look out for Goodman’s name in an upcoming Benjamin Dean Lecture at the Academy! Although we haven’t posted links to the April lecture just yet, you can expect to see her presenting to Morrison Planetarium audiences in just a few months. And you can expect a perceptive, visually engaging talk!
Ryan Wyatt is Director of Morrison Planetarium and Science Visualization at the California Academy of Sciences.