In this activity, students will:
- Learn how to interpret seismic data.
- Learn how to triangulate.
- Use data to predict locations of tectonic plates.
- Learn that seismic activity (earthquakes) is caused by the movements of tectonic plates.
© 2009 California Academy of Sciences
How can we determine the locations of tectonic plate boundaries? How can we use seismic waves to pinpoint the epicenter of an earthquake? In this activity, students will explore these and other questions using seismic data and triangulation.
In this activity, students will:
1. Gather materials and print copies of the worksheet (1 copy per student).
2. Print out on transparencies 6 copies (1 per group) each of:
3. Plan your time; this activity has several parts and may take multiple class periods to complete. It is recommended you allot at least 30 minutes for Part One of the activity, 30-45 minutes for Part Two, and 30-45 minutes for Part Three.
Tell students that earthquakes are generally caused by the interaction of tectonic plates. How tectonic plates are interacting can be determined by land features. For example, in areas where there are mountains and volcanoes, plates are colliding. In areas where there are rift zones or ocean ridges, plates are diverging and in places where there are not a lot of mountains but there are a lot of earthquakes, the plates are sliding against each other.
Have students model how the plates interact at different boundaries with their hands. Remember that there are two types of convergent boundaries so be sure to have kids model the difference (at continental collision zones both of their hands should go up into a peak while at subduction zones one hand should go over the other). For divergent boundaries, their hands should start together and then move apart. For transform boundaries, their hands should just slide past each other.
Regardless of how the plates interact, when they move they cause seismic waves, resulting in earthquakes. Scientists can use seismic data to determine where the waves originated and can then use that data to map the locations of the plates – which is what students will do in this activity.
Part One: S and P waves
1. Ask students what causes earthquakes? (movements of tectonic plates)
2. Ask students about types of waves and how they are similar and different. (For example, light waves and sound waves travel at different speeds. When you drop a pebble in the water the waves radiate out in all directions but when you send a wave through a rope is only travels in one direction )
3. Tell students that when earthquakes occur two types of body waves (waves that travel through the earth) are created.
4. Bring two student volunteers to the front of the class. Give them a slinky and have them model S and P waves.
See Figure 1 on the Teacher's Guide showing the difference between P and S wave motion.
5. Ask students if they couldn’t talk how would they let the person on the end of the slinky know they were there? (If they shake their slinky the other person will feel the wave. This is how people from all over the earth know that an earthquake has occurred. Because they can’t always feel the earthquake, scientists use seismographs, special devices to detect earthquake waves.)
6. Bring two more student volunteers up to the front of the class and give them the other slinky. Have one group of students create longitudinal waves with their slinky at the same time that another group creates transverse waves with their slinky. Have the class observe the waves. Are they traveling at the same speed? Which one is moving along the slinky faster?
7. Tell students that these two types of waves travel at different speeds: P waves travel faster than S waves. At seismic stations, seismographs register the exact time the P wave reaches the station and then registers the exact time the S wave reaches the station. Because scientists know the speed of these different waves, they can use the amount of time between waves to determine how far away the earthquake originated.
8. Do the following demonstration explaining how things traveling at different speeds in the same direction get farther apart based on how far they travel.
9. Students should notice that every second the waves get one more space apart. Therefore, if the waves are 5 spaces apart, they must have been traveling for 5 seconds.
10. Have two students in the line model seismograph stations, one student near the beginning of the line and one near the end. These seismograph students should start counting when a P wave reaches them and count the number of rounds until the S waves reaches them. Based on this count they can predict how far away the earthquake was. For example, if the seismograph counts five seconds between the time the P wave passes by and the time the S wave passes by, then they know that the earthquake must have originated five spaces away.
11. Explain that using one seismograph, scientists can determine how far away an earthquake is but cannot indicate which direction it came from. Therefore, geologists need to use data from other seismographs to determine where the epicenter of the earthquake is. This process is called “Triangulation.”
Part Two: Triangulation
1. Put students into six groups and hand out a worksheet to each group.
2. Give each group one clipboard, one transparency map of earth with lines of longitude and latitude, and one transparency “What’s shaking? Locating Global Plate Tectonics.”
3. Have students put the “What’s shaking?” map into the clipboard along with the world map showing latitude and longitude.
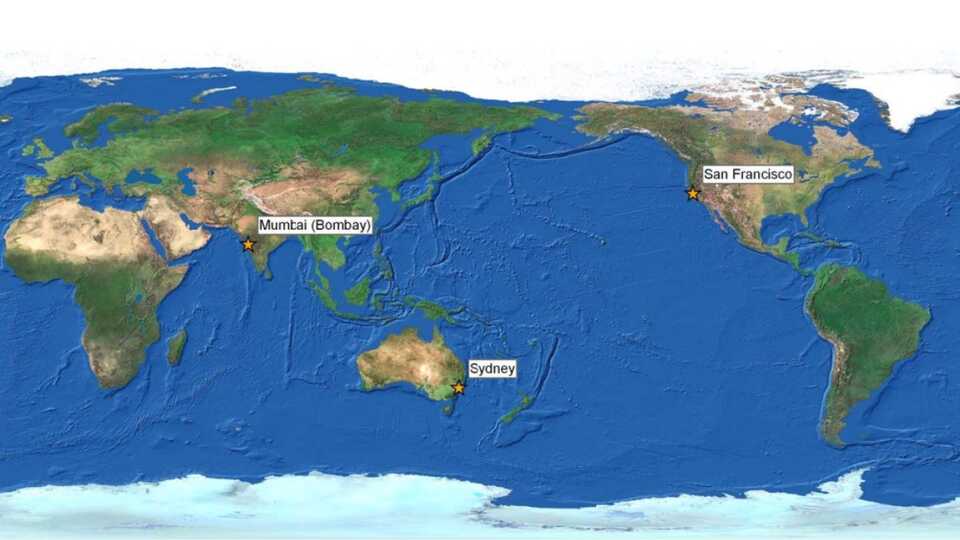
4. Assign one city (Mumbai, San Francisco, and Sydney) to each member of the group and assign one member to be the Seismograph. If you have some groups with 5 people, you can make one person the recorder.
5. Have each student in the group locate their city on the map.
6. Tell students that they are going to act out an earthquake. The teacher will say “Sydney Shake” and the student who was assigned Sydney shakes for a moment and stops. This represents the P wave reaching the city. After a certain number of seconds (see table below) the teacher repeats “Sydney Shake” and the student shakes again, representing the S wave reaching the city.
7. The seismograph student counts the number of seconds between shakes. They can do this with a stopwatch, although it can sometimes be tricky for students to do that accurately enough for the map to work out perfectly. An alternative is to have the class clap rhythmically to mark the seconds passing, as they did during the earlier activity.
8. Repeat this process for San Francisco and Mumbai.
9. For our purposes in this activity, each second corresponds to 1500 km. (Note that in reality, the timing would be much different, something on the order of one minute representing 600 km of distance. We are using an unrealistic value in this activity to avoid having to wait several minutes between waves while acting it out. Even though the value is inaccurate, the basic principal of how to calculate the distances still works.) In order to calculate the distance from the earthquake to the cities, students should multiply the time between shakes by 1500 km. For example, there were 5 seconds between shakes in Sydney. Therefore, the earthquake was 7500 km from Sydney (5 x 1500 km = 7500 km). See Table 1 on the Teacher's Guide for timing and distances for the first earthquake for all cities.
10. Students should use the distance scale on the map to spread the compass to the appropriate distance. The scale bar shown on the map is too short for some of these measurements; to accommodate the larger numbers and measure more accurately you can use a ruler. The scale on the Map is 1cm = 1666km.
11. Have students draw a circle, using Sydney as the center point, on the clipboard with the compass set at approximately 7500 km.
12. Ask students if that is enough information to figure out where the earthquake originated. They should observe that they know the earthquake came from someplace on the circle, but they can’t tell from which direction. Therefore, they need to plot the data from the other 2 cities.
13. Have students draw circles for the other 2 cities.
14. There should be a triple point where the lines from all three circles meet (or come close to meeting). This is the epicenter of the earthquake. Have students make a red X where the epicenter should be. Note that it can be a little tricky to get a perfect triple point, and students should just aim to get as close as possible.
15. The location of the first earthquake is in the Indian Ocean.
16. Plot a second earthquake by repeat steps 4-15 with the times listed on Table 2 in the Teacher's Guide.
17. The location of the second earthquake is in the Pacific Ocean.
18. Discuss with students that earthquakes are the result of tectonic movement and that one way the scientists know where tectonic plate boundaries are is from earthquake location data.
Part Three: Boundaries
1. Show students how to plot seismic data from their worksheet. You may need to demonstrate how to use the longitude and latitude coordinates to locate points on a map. A negative latitude means in the southern hemisphere; a positive latitude means the northern hemisphere. A negative longitude means in the west; a positive longitude means in the east. Tell students that they will need to approximate the locations using the longitude and latitude markings.
2. Note that if desired, you can get the coordinates of actual recent earthquakes directly from the USGS website instead of using the worksheet. You can find all the large earthquakes from the past seven days here and the smaller earthquakes here.
3. Have students plot several of the points on their maps (as many as time allows). The more points they plot, the easier it will be to see a pattern emerging.
4. Remind students that most earthquakes occur at plate boundaries. We also know that volcanoes occur at plate boundaries because two plates are colliding and generally one plate is being subducted under another.
5. Hand out the volcano transparencies and have students place them in their clipboards.
6. In their groups, have students predict where boundaries between tectonic plates are located by tracing lines between earthquakes and volcanoes. You can give them clues such as that there are 7 major plates and that generally plate boundaries are associated with volcanoes.
7. Once students have made their predictions by drawing on their clipboards, hand out the tectonic plate boundary transparencies. Have students place the transparency in their clipboard. Point out how the boundaries follow the same lines as the volcanoes and earthquakes. Point out the “Ring of Fire,” an area from Indonesia, through Japan and around Alaska and consists of a huge chain of volcanoes.
8. Hand out the earthquakes 1973-2009 transparency. Have students put this in their clipboard.
9. Explain that this is earthquake data from the last 30 years. Show students that if they were able to plot enough points they would have been better able to determine the plate boundaries.
Briefly explain the theory of plate tectonics to the students. Remind students of the three types of plate boundaries and the type of surface phenomena associated with these boundaries. If desired, put the plate boundary and “What’s shaking?” transparencies on the overhead projector and point out the major landforms associated with plate boundaries.
Grade Six
Earth Sciences
1a. Students know evidence of plate tectonics is derived from the fit of the continents; the location of earthquakes, volcanoes, and mid-ocean ridges; and the distribution of fossils, rock types, and ancient climatic zones.
1b. Students know Earth is composed of several layers: a cold, brittle lithosphere; a hot, convecting mantle; a dense, metallic core
1c. Students know lithosphere plates the size of continents and oceans move at rates of centimeters per year in response to movements in the mantle
1d. Students know that earthquakes are sudden motions along breaks in the crust called faults and those volcanoes and fissures are locations where magma reaches the surface
1e. Students know major geologic events, such as earthquakes, volcanic eruptions, and mountain building, result from plate motions.
1g. Students know how to determine the epicenter of an earthquake and know that the effects of an earthquake on any region vary, depending on the size of the earthquake, the distance of the region from the epicenter, the local geology, and the type of construction in the region.
Physical Sciences
3c. Students know heat flows in solids by conduction (which involves no flow of matter and in fluids by conduction and by convection (which involves flow of matter)
Investigation and Experimentation
7b. Select and use appropriate tools and technology (including calculators, computers, balances, spring scales, microscopes, and binoculars) to perform tests, collect data, and display data.
Grade Seven
Earth and Life History (Earth Sciences)
4a. Students know Earth processes today are similar to those that occurred in the past and slow geologic processes have large cumulative effects over long periods of time.
Investigation on Experimentation
7a. Select and use appropriate tools and technology (including calculators, computers, balances, spring scales, microscopes, and binoculars) to perform tests, collect data, and display data.
7c. communicate logical connection among hypothesis, science concepts, test conducted, data collected, and conclusions drawn from scientific evidence.
7d. Construct scale models, maps, and appropriately labeled diagrams to communicate scientific knowledge (e.g. motion of Earth’s plates and cell structure).
Geology.com. Retrieved January15, 2009 from http://geology.com/plate-tectonics.shtml
Incorporated Research Institutions for Seismology. Retrieved December 3, 2009 from http://www.iris.edu/hq/
USGS. This Dynamic Earth: The story of plate tectonics. Retrieved January 7, 2009 from http://pubs.usgs.gov/gip/dynamic/dynamic.html
USGS. Earthquake data from 1973-2009 Retrieved January 7, 2009 from
A complimentary extension to the lesson Global Climate Change and Sea Level Rise.
What kinds of everyday objects contain carbon? This introductory activity will help you get it straight!
By building your own seismograph to document shaking, you'll learn how scientists measure earthquake intensity.