We're open daily! View holiday hours
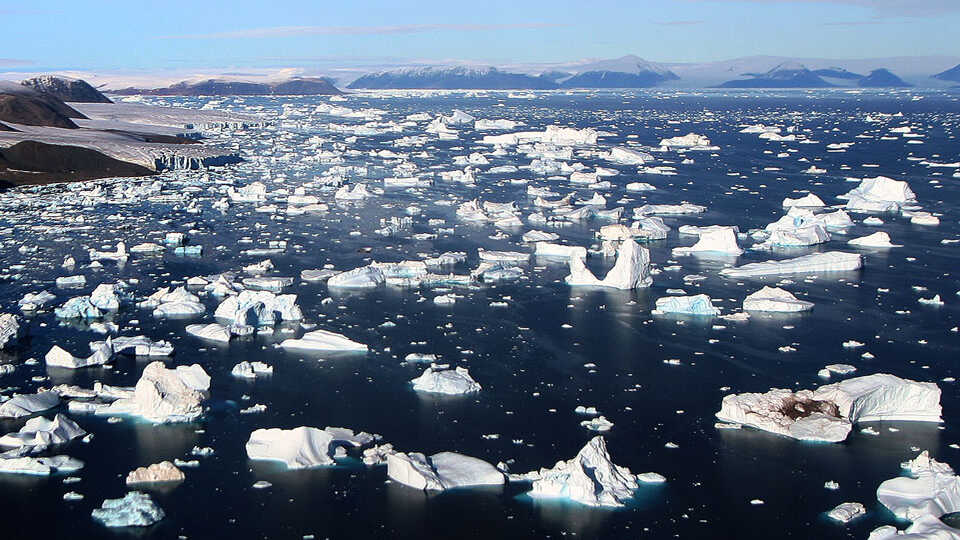
© Brocken Inaglory
0
We know that melting glaciers lead to sea level rise, but what else? This lesson extension to Global Climate Change and Sea Level Rise demonstrates the role density plays in water circulation and paves the way to discussing thermohaline circulation, or the "great ocean conveyor belt."
Objectives
Students will:
- Discover the difference in densities between saltwater and freshwater.
- Discuss the implications of global climate change as it pertains to thermohaline circulation.
Materials & Teacher Prep
- 1 clear food storage box (approximately 6 in square) per group
- 4 sticks of classroom modeling clay per group
- Blue food coloring (red or green works too)
- Ice cube trays
- 4-5 intensely colored ice cubes per group (make these ahead of time)
- Salt
- 1/2 liter of refrigerated water per group
- Differing Densities worksheets
Scientific Terms for Students
- global climate change: change in average global temperature, rainfall, and wind patterns as a result of increased greenhouse gases in the atmosphere
- greenhouse gases: gases in Earth’s atmosphere that trap heat
- density: a measurement of compactness, measured as mass per unit volume
Activity Introduction
- Explain that landlocked ice is often made from freshwater, whereas ocean water is salty. Ask students what they think happens when landlocked ice made from freshwater melts and flows into salty ocean water. Explain that they will be doing an experiment to see what happens in this situation.
- Hand out the Differing Densities worksheet, and guide students through writing a question and making a prediction.
Design the Experiment
- Introduce the materials. As a whole class or in small groups, help the students come up with a way to model this scenario using methods similar to those for the first experiment.
- Have students describe or draw the procedure in the methods section of their worksheet.
Suggested Procedure
Conduct the same experiment as in Global Climate Change and Sea Level Rise with the following modifications:
- When freezing the ice cubes, put lots of food coloring into the water before filling the trays. This will make colored ice (the darker, the better).
- Add salt to the water that will be poured into the boxes in a ratio of 3 tablespoons of salt to 1 liter of refrigerated water*. This makes your water approximately the same salinity as the ocean.
-
*It is important to use cold water for this activity because, as discussed earlier, liquids become denser as they cool. If the water from the melting ice is significantly colder than the saltwater in the pan, the difference in density (caused by variation in temperature) may negate the effect of the difference in salinity. This could cause the colored fresh water to sink instead of float.
-
- Use the colored ice in place of regular ice, and build your “landlocked ice” box as previously outlined, using the cold, salty water to pour into the container.
- Allow the ice to melt and watch where the fresh water (blue color) accumulates. If all goes well, it should sit on top of the salt water.
- Ask students to record what happened in the results section of their worksheet.
Interpret the Data
- Have a discussion about density, and what causes the observed result. Ask students to write in their own words why the blue colored water floats on the clear water.
- Discuss potential problems associated with a layer of freshwater floating on the ocean in the North Atlantic (see Educator Background below).
- This video from NASA helps to show the route water takes in thermohaline circulation. How would global climate change affect this phenomena?
Background for Educators
When salt dissolves in water, the salt adds mass to the water but does not increase the volume of the water very much. Thus, saltwater is denser than fresh water and fresh water will float on the surface of seawater.
In the North Atlantic, a phenomenon based on this concept drives a process known as thermohaline circulation or the “great ocean conveyor belt” (Windows to the Universe, 2007). In this area, surface water moving north from low latitudes becomes saltier (due to evaporation) and colder as it moves northward. This causes the density of the water to increase, and the water eventually sinks as it enters the North Atlantic. When the water sinks, it drives a current that plays a significant role in global ocean circulation. The sunken water (it’s colder and more dense) slowly flows along the bottom of the ocean back toward the lower latitudes where it eventually rises, like a conveyor belt, to the surface and starts the journey north again. Thermohaline circulation is extremely important in maintaining hospitable climates around the globe because it contributes to the overall circulation of warm water from near the equator towards the poles.
Glacial melting in Greenland has caused concern because of the potential for significant increase of fresh water in the North Atlantic (Windows to the Universe, 2007). If melting rates continue to increase with global warming, a layer of freshwater could theoretically form in the North Atlantic. This fresh water could mix with the salty, dense water of the North Atlantic and stop the sinking of North Atlantic water, thereby altering the driving force behind the great ocean conveyor belt current. Although projections are speculative, scientists suggest that a disruption in this circulation could lead to a cold climate shift in Europe as well as unpredictable changes in other parts of the globe.
In this exercise, students will be able to visualize differences in water density and relate this to potential consequences of increased glacial melting.
California State Content Standards
Grade Five
Investigation and Experimentation
6b. Students will develop a testable question.
6f. Students will select appropriate tools and make quantitative observations.
6g. Students will record data by using appropriate graphic representations, and make inferences based on those data.
6i. Write a report of an investigation that includes conducting tests, collecting data or examining evidence, and drawing conclusions.
Grade Eight
Physical Sciences: Density and Buoyancy
8a. Students know density is mass per unit volume.
Next Generation Science Standards
Science & Engineering Practices
- Developing and Using Models: Develop and/or use models to describe and/or predict phenomena. (3-5; 6-8)
- Asking Questions and Defining Problems: Ask questions that can be investigated and predict reasonable outcomes based on patterns such as cause and effect relationships. (3-5)
- Planning and Carrying out Investigations: Plan and conduct and investigation collaboratively to produce data to serve as the basis for evidence. (3-5) Collect data to produce data to serve as the basis for evidence to answer scientific questions. (6-8)
- Analyzing and Interpreting Data: Represent data in table and/or various graphical displays to reveal patterns that indicate relationships (3-5; 6-8). Analyze and interpret data to make sense of phenomena, using logical reasoning, mathematics, and/or computation (3-5).
- Constructing Explanations and Designing Solutions: Use evidence to construct or support an explanation or design a solution to a problem. (3-5) Construct an explanation using models or representations. (6-8)
Disciplinary Core Ideas
- ESS3.C: Human Impacts on Earth Systems: Human activities in agriculture, industry, and everyday life have had major effects on land, vegetation, streams, oceans, air and even outer space. (Grade 5)
- ESS2.C: The Role of Water in Earth’s Surface Processes: Variations in density due to variations in temperature and salinity drive a global pattern of interconnected ocean currents. (6-8)
- ESS3.D: Global Climate Change: Human activities such as the release of greenhouse gases from burning fossil fuels, are major factors in the current rise in Earth’s mean surface temperature (global warming) (6-8).
Cross-Cutting Concepts
- Cause and Effect: Cause and effect relationships are routinely identified, tested, and used to explain change. (3-5; 6-8)
- Stability and Change: Change is measured in terms of differences over time and may occur at different rates; Some systems appear stable, but over long periods of time will eventually change (3-5). Explanation of stability and change in natural or designed systems can be constructed by examining the changes over time and forces at different scales (6-8).
Related Performance Expectations
- MS-PS1-5: Develop and use a model to describe how unequal heating and rotation of the Earth cause patterns of atmospheric and oceanic circulation that determine regional climates.
References
- Climate Institute. (n.d.). Consequences of Climate Change on the Oceans. Retrieved November 17, 2014 from http://www.climate.org/topics/sea-level/
- NASA Scientific Visualization Studio. “The Thermohaline Circulation - The Great Ocean Conveyor Belt.”
- US Geological Survey. Water density. (2014). Retrieved November 17, 2014 from http://water.usgs.gov/edu/density.html
- Windows to the Universe. Thermohaline ocean circulation. (2007). Retrieved November 17, 2014 from http://www.windows2universe.org/earth/Water/thermohaline_ocean_circulation.html
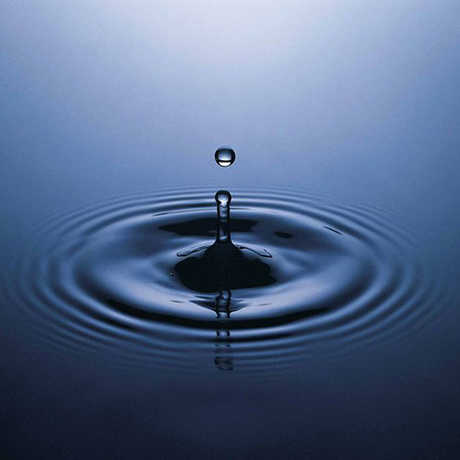
Where is all of our planet's water stored?
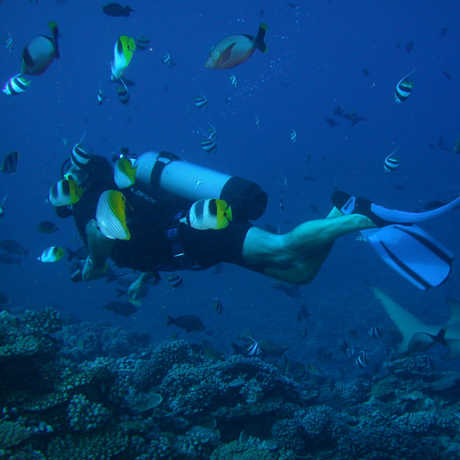
Learn about buoyancy by creating a creating a neutrally buoyant "scuba diver."
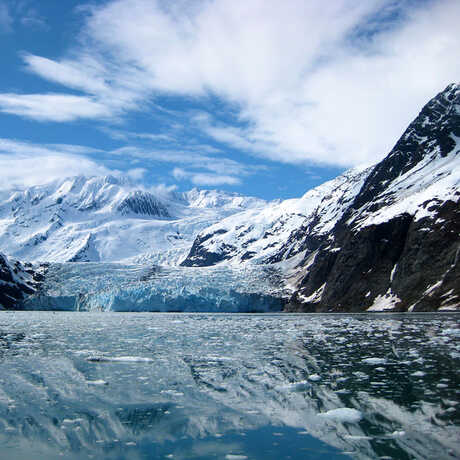
Which type of ice causes a rise in sea level when it melts: glaciers, icebergs, or both?
Appropriate for: 5th Grade - 8th Grade
Standards for: 5th Grade, 6th Grade, 7th Grade, 8th Grade
Prep Time: 20 minutes
Activity Time: 60 minutes
Subjects: Asking Questions, Earth & Space Science