You are Here: Notes
You and your students probably use many tools for comparison in English Language Arts. Learn how these tools can serve your students in science learning as well. From Top Hat to Double Bubble Map, these strategies will support students as they describe differences and similarities in your science classroom.
Comparing is a useful tool in science. Whether they are comparing food chains and food webs, organisms with similar adaptations, or different rocks from the same environment, comparisons help students see similarities and differences. This in turn can help students organize and categorize things, just as professional scientists do to make meaning of the world around them. Comparing can be supported with explicit scaffolds like the ones shown here:
Because we know teachers appreciate seeing the results of using these strategies, we've also created an example gallery containing student work.
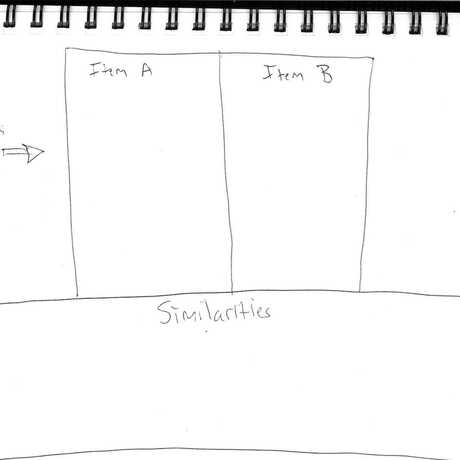
The top hat is drawn just like it sounds. The “hat” is split in half, with each half dedicated to one item and its unique features. The “brim” is the place to list features in common to both things. It’s a great tool for comparing, putting the differences at the top and the similarities at the bottom. The box and t-chart is just like a top hat, but upside down. It puts the similarities at the top and the differences at the bottom. This scaffold is useful if you want students to observe similarities first and differences second. [i]
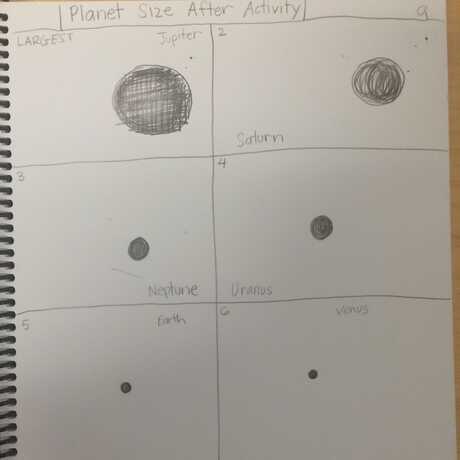
Tables are versatile and allow students to compare multiple things at once. They can use as many rows or columns as you like, depending how many things you want them to compare. Tables are useful for comparing multiple items at the same time, like the sizes of different planets, or for tracking the changes to a phenomenon over time, like phase changes of the moon.
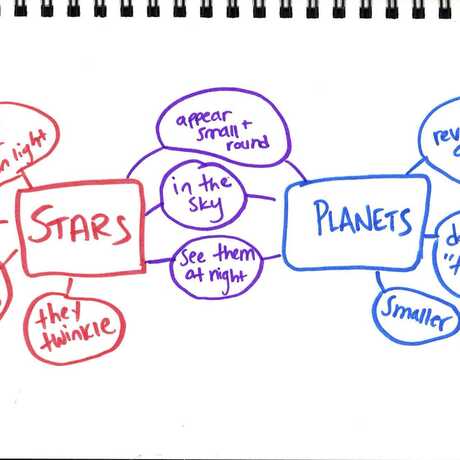
This map is another tool to compare two things. Students draw two big bubbles for the two items they will compare. They connect the items to smaller bubbles, each one describing a difference or similarity. The similarities are placed in-between the two items, while the differences are placed outside of the items. Here is an example of a double bubble map comparing stars and planets.
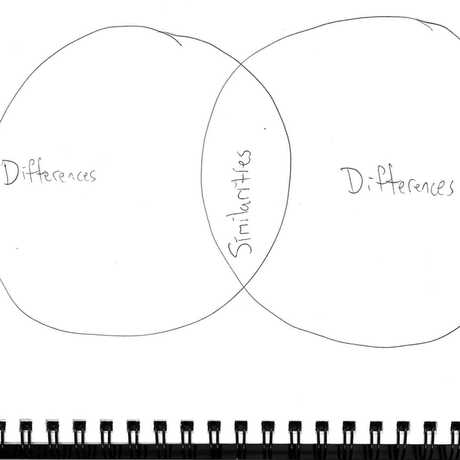
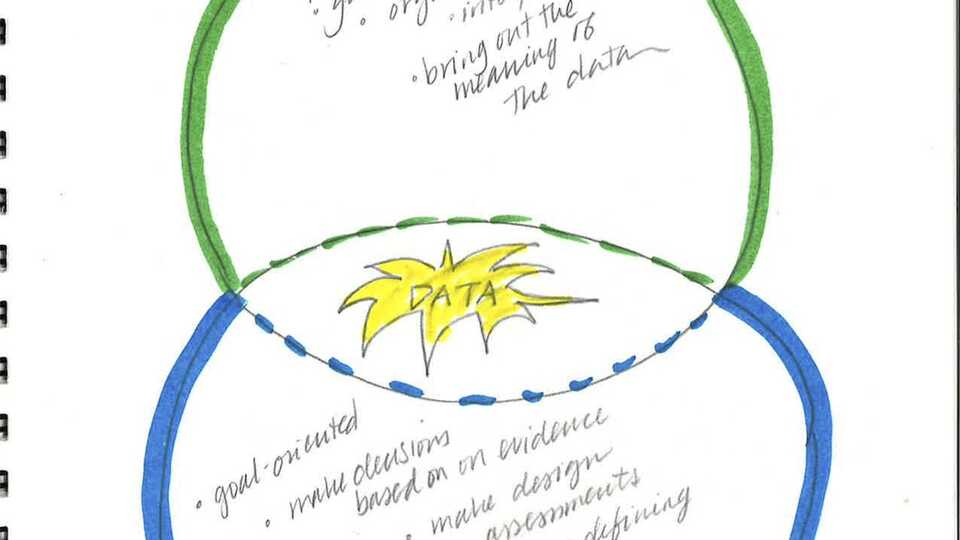
A classic! This scaffold is great for easily showing similarities and differences. The overlapping parts of the circle are where similarities fall. The separate circles are for differences. Venn diagrams with only two circles are a great place to start. Venn diagrams can become more advanced and complex by adding additional circles and areas of overlap. Students having trouble fitting all the words in the circles could use columns instead of circles for their Venn Diagram.
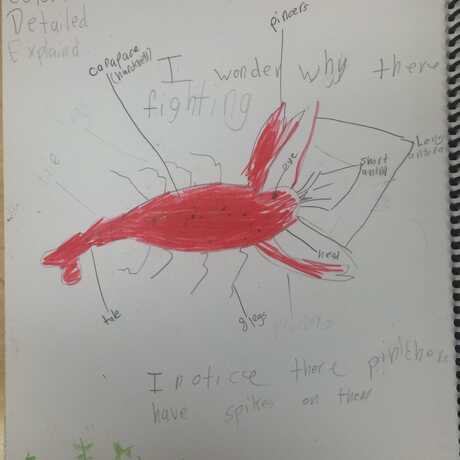
May had years of experience teaching her 2nd grade English Language Learners to read and write. However, she struggled with teaching science. She felt uneasy with the content and unfamiliar with the curriculum. But, she knew her students loved the crayfish she brought into the classroom every year. She decided to borrow a tool her students already used in English Language Arts: the double bubble map. She had her students sketch the crayfish and make comparisons between the males and females, how adults compare to juveniles, and how crayfish compare to crabs and lobsters. May capitalized on her students’ enthusiasm for the class pets and on their familiarity with the double bubble map. Her confidence with science teaching increased when she realized how easily scaffolds could carry over from ELA.
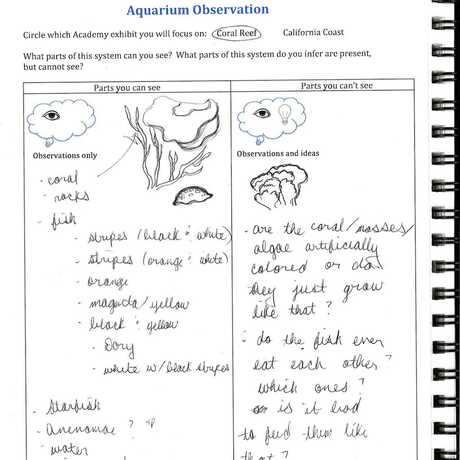
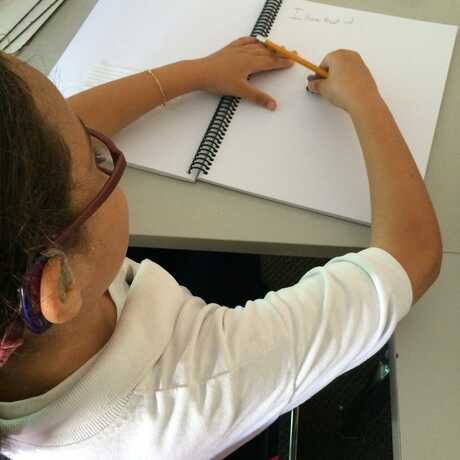
Use notebooks to help students learn actively during field trips.
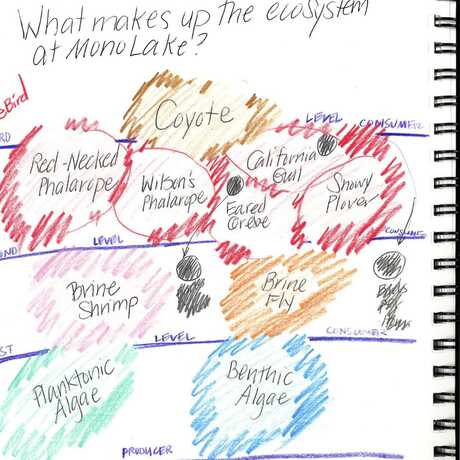
Students can map concepts in the notebook to make their understanding visible.
Have you used notebooks to help your students understand science texts?
Learn how notebooks can help your students think and act like scientists.