You Are Here: Investigations

When we empower students to collect and evaluate data, they learn how to make scientific meaning out of concrete evidence. The science notebook is a useful tool for both data stages: collection and analysis.
Below, you'll find guidance related to helping students collect and analyze data, including:
Because we know teachers appreciate seeing the results of using these strategies, we've also created an example gallery containing student work and photographs of scaffolds on the walls of classrooms.
Most kinds of data fall into two broad categories:
Depending on your goals and constraints, you may choose one of these options:
Depending on your learning objectives, you can decide from several options:
Again, your learning objectives will determine which option you choose:
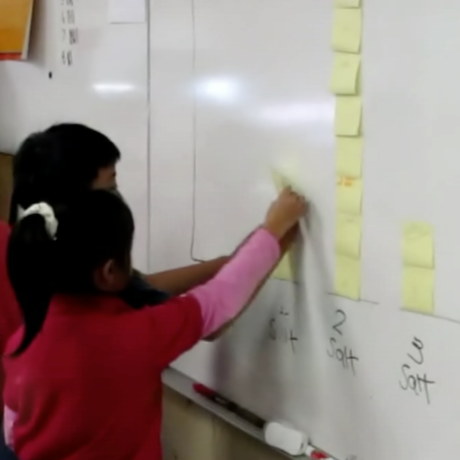
John loved doing a brine shrimp hatching experiment with his 4th graders. However, he didn’t like the data collection template provided by his curriculum; he felt it was too limiting for his students. Instead of using the template, he decided to make a giant bar graph on the board. He had his students place a post-it on the board if their bring shrimp hatched with 1 scoop of salt. He repeated the process with 2 scoops, 3 scoops, and so on. This strategy got his students up and moving, and involved them in co-constructing a class data table. Students could easily see that the bar of post-its for 2 scoops was significantly higher than the other categories. Because the students had supplied the data for the bar graph, they were more invested in the meaning-making. John, in the process, could hang back and let his students figure it out.
The materials are put away, the data is organized, the graphs have been made… now what do you do?
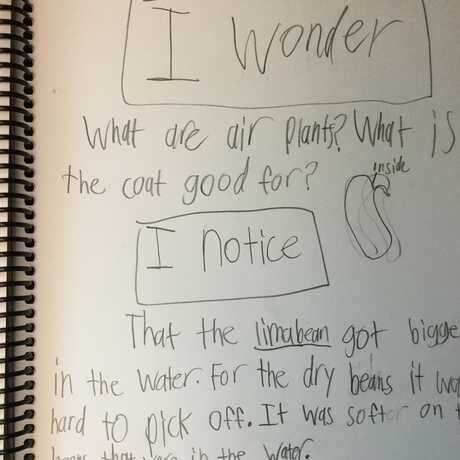
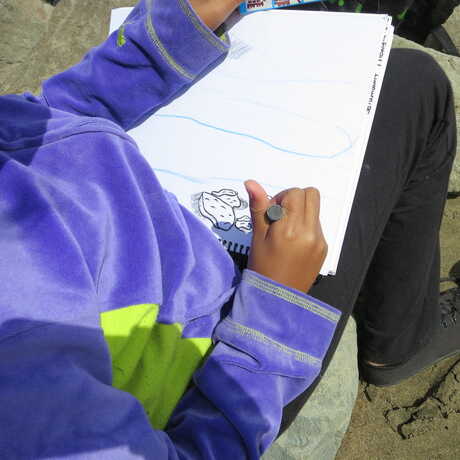
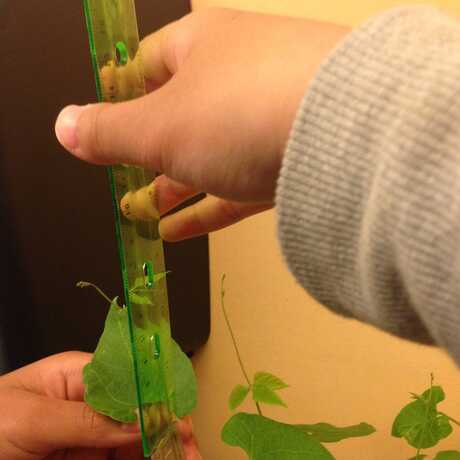
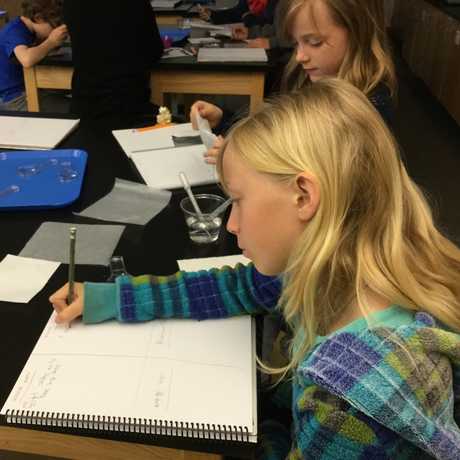
Scientific sketching is about looking at something so closely you notice something new.
Learn how notebooks can help your students think and act like scientists.