After viewing the Solutions to Human Impacts video:
What do you notice in this image? Do you see any evidence of human impacts on the marine environment, direct or indirect?
- Using these prompts with photographs or satellite images gives your students the opportunity to directly observe how human activities could be contributing to issues like nutrient pollution or invasive species. Here are some free photo and satellite image sources:
- Google Earth is a great resource to use in this exercise not only because it is free, but because in many places you can look at changes through time. Use Google Earth to identify sources of nutrient or other water pollution in your community.
- The California Coastal Records Project is an extensive collection of high-resolution oblique aerial photographs of the California coastline over time. In these photos, you can see just how close some agricultural fields and other potential sources of pollution are to the ocean.
- NASA's Images of Change show beautiful but sometimes haunting satellite images of changes on Earth's surface over time, including these images showing the before and after of the Elwha Dam removal in Washington State, and these images showing artificial island construction in the UAE.
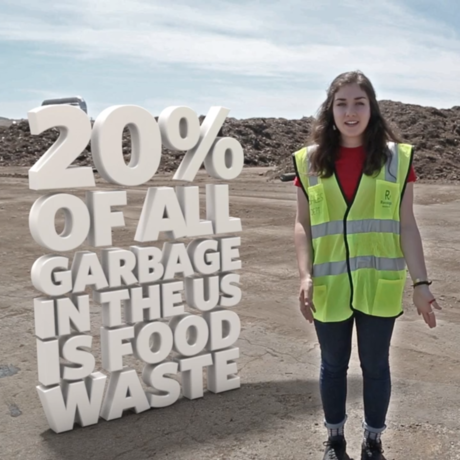
After viewing the Sustainable Seafood video:
One of the ways that we know how our fishing practices have impacted marine species is by doing 'stock assessments,' or collecting data about the abundance of different species and how this has changed over time.
- NOAA Fisheries Service maintains the Species Information System Public Portal, a user-friendly database of marine stock assessments and other information. Your students can analyze and interpret time series graphs of parameters like abundance and catch for almost 200 different commercially-important fish species.
- In addition to analyzing graphs, students can use the Mapping Tool to search for and visualize where around U.S. waters there are overfished stocks. Using the information in this database, hold a Classroom Conference on Sustainable Fishing complete with oral and poster presentations on the status of U.S. fish stocks and what people are doing to protect and sustain these stocks.