From Leaf to Landscape
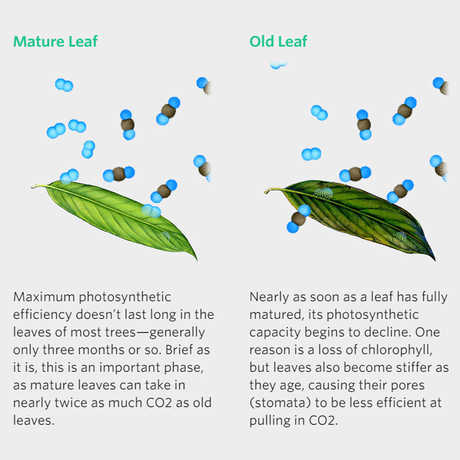
A rainforest’s ability to take a deep breath depends on a somewhat surprising factor—the age of its leaves.
The Color of Drought
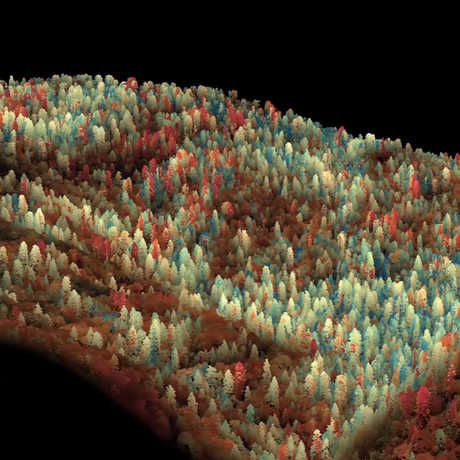
In this silent video, view color-coded data which show how California's trees were affected by drought in 2016.
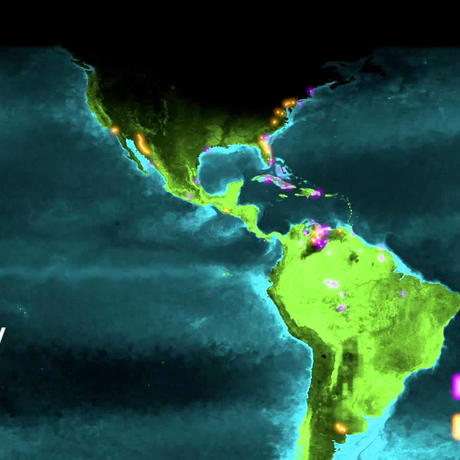
Catching the Rainforest's Breath
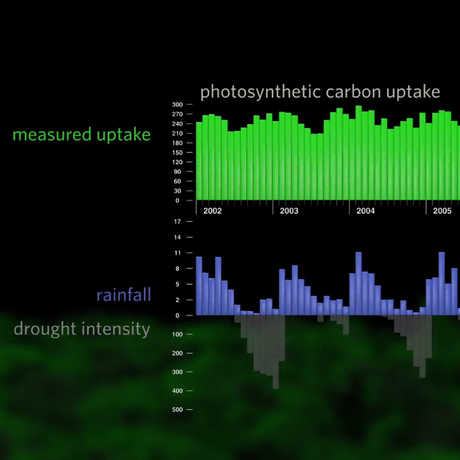
Ecosystem-wide, is the Amazon storing or releasing more carbon dioxide? Watch this silent clip to view the data.
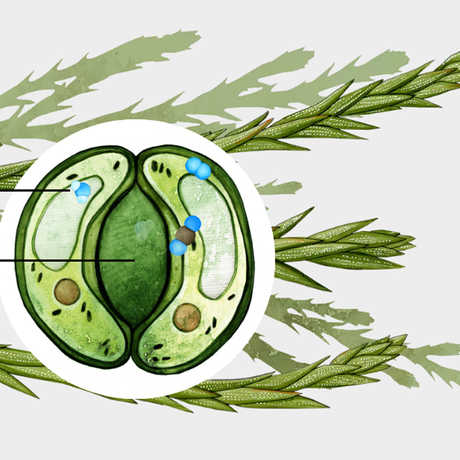
Travel Deep Inside a Leaf
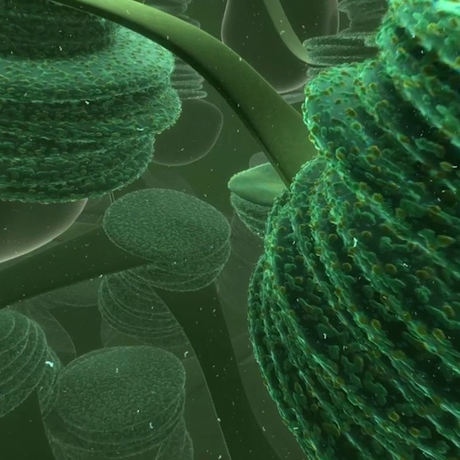
What would you see if you could shrink down to fit inside a plant cell?
Plate Tectonics & Earthquakes
Evidence of Plate Tectonics
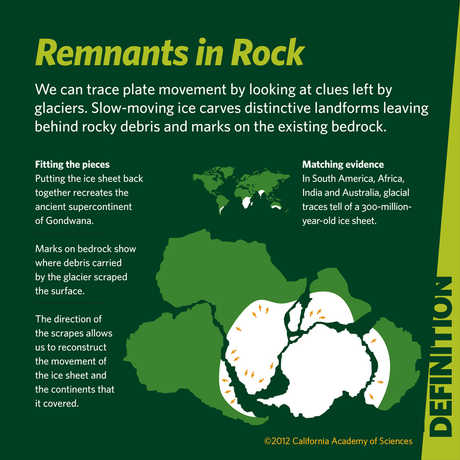
Evidence from fossils, glaciers, and complementary coastlines helps reveal how plates once fit together.
From Core to Crust: Defining Earth’s Layers
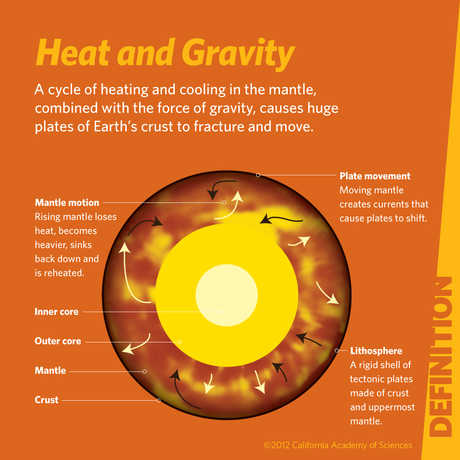
The inside of our planet is made primarily out of iron and nickel and dark, dense rock.
Anatomy of an Earthquake
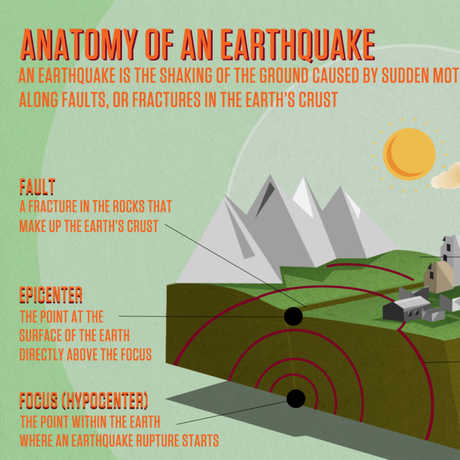
Learn about all the individual elements and forces that make up an earthquake.
Sequence: How Seasons Affect Producers and Consumers
Why Do We Have Different Seasons?
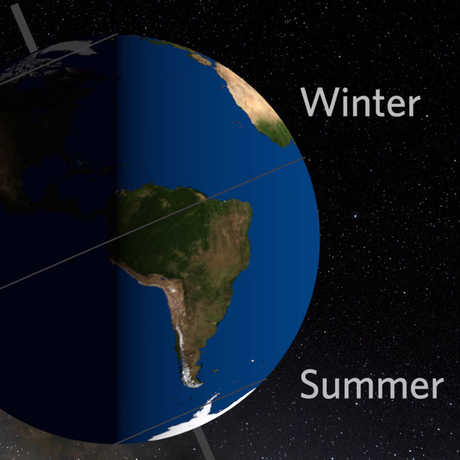
In this video, learn how Earth’s rotation and the angle of sunlight interact to create different seasons.
Timelapse: Photosynthesis Seen From Space
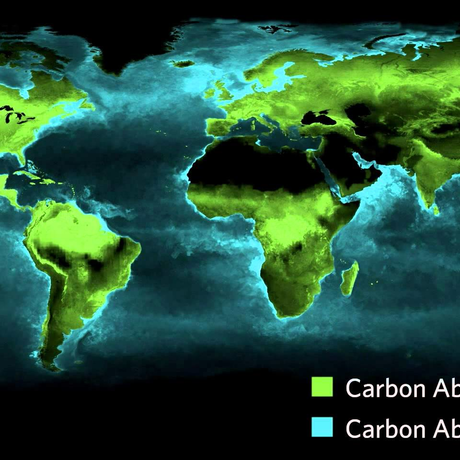
Witness the influence of the sun on the seasonal abundance of plant matter produced on land and in our oceans.
Why Do Birds Migrate?
See how seasonal changes drive patterns in animal behavior.
Connections to Human Society
How Did Human Civilization Spread?
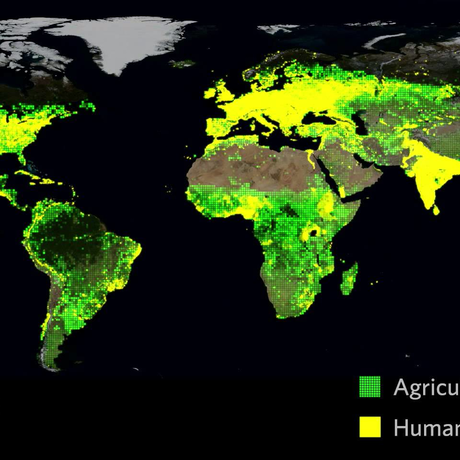
How is the development of human population centers linked to the development of agriculture?
How Quickly Do Ships Cross the Oceans?
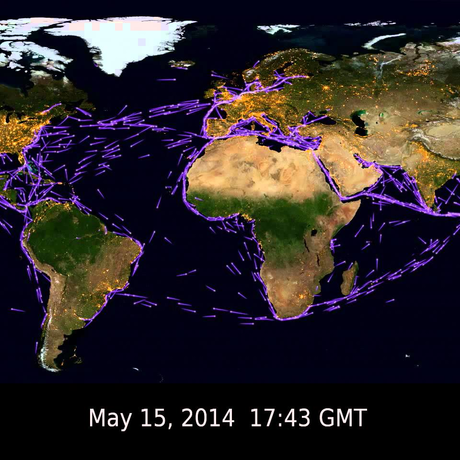
This clip demonstrates global ship traffic over an eleven day period.
How Many Planes Are in the Sky?
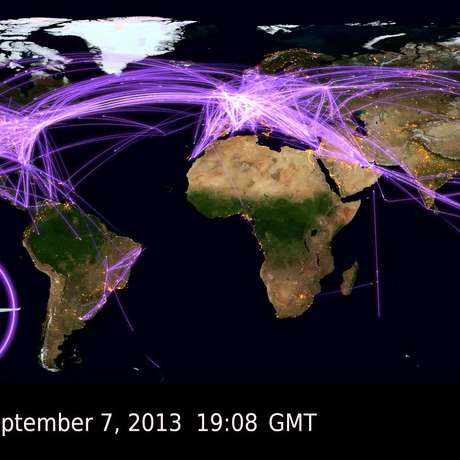
Real-time air traffic reveals travel patterns occurring on timescales far more rapid than species migration.
Teaching Tips
Infographics in the Classroom Teacher Toolkit
This toolkit provide ideas, strategies, and resources for incorporating infographics into science curricula.